The renovation ran 2.5x over budget and produced 3x the rent bump. John Casmon on the Boone County data behind an 81-unit Florence buy, and the census-tract tool he uses instead of radius reports.
An 81-unit townhome community in Florence bought at the top of the 2021 market sold at a profit while comparable Sun Belt vintage sold at a loss. This post breaks down the Boone County data that justified the buy, the renovation budget that ran 2.5x over and produced 3x the rent bump, and the submarket screening process behind it, including a free census-tract income tool most investors never open.
About This Post
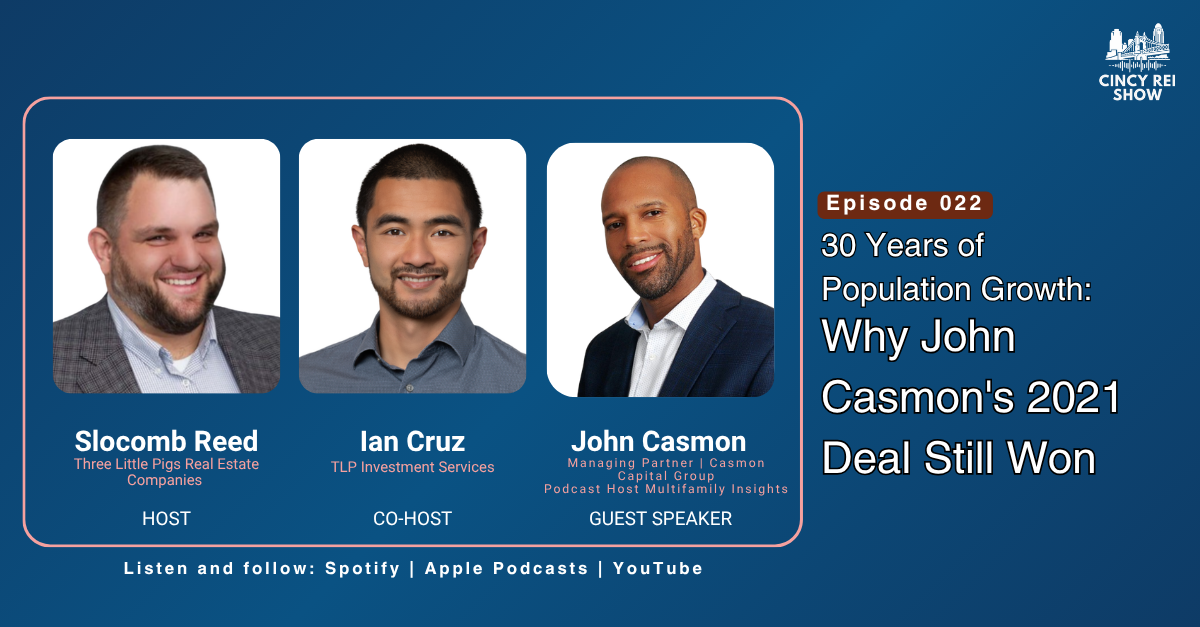
This analysis draws from a conversation with
John Casmon, general partner on over $150 million of apartment deals, host of the Multifamily Insights podcast, and owner of United Water Restoration Group. Casmon bought a 28-unit Cincinnati building while still living in Chicago, moved to Greater Cincinnati in 2019, and has hosted a local investor meetup for seven years.
Listen to the full conversation on
Spotify,
Apple Podcasts, and
YouTube. The full episode also covers rate cap mechanics and counterparty risk, the BiggerPockets era and what replaced it, and Casmon's Cincinnati hidden gems.
The Cincy REI Show publishes every Monday. New episodes cover neighborhood-level analysis, local investor strategies, and real deal stories from operators active in Greater Cincinnati.
Boone County, Norwood, and the Montgomery Corridor: Where Investors Are Buying
Casmon's buy board is built on population direction rather than neighborhood reputation. He looks for markets that are already moving so he does not have to move them himself.
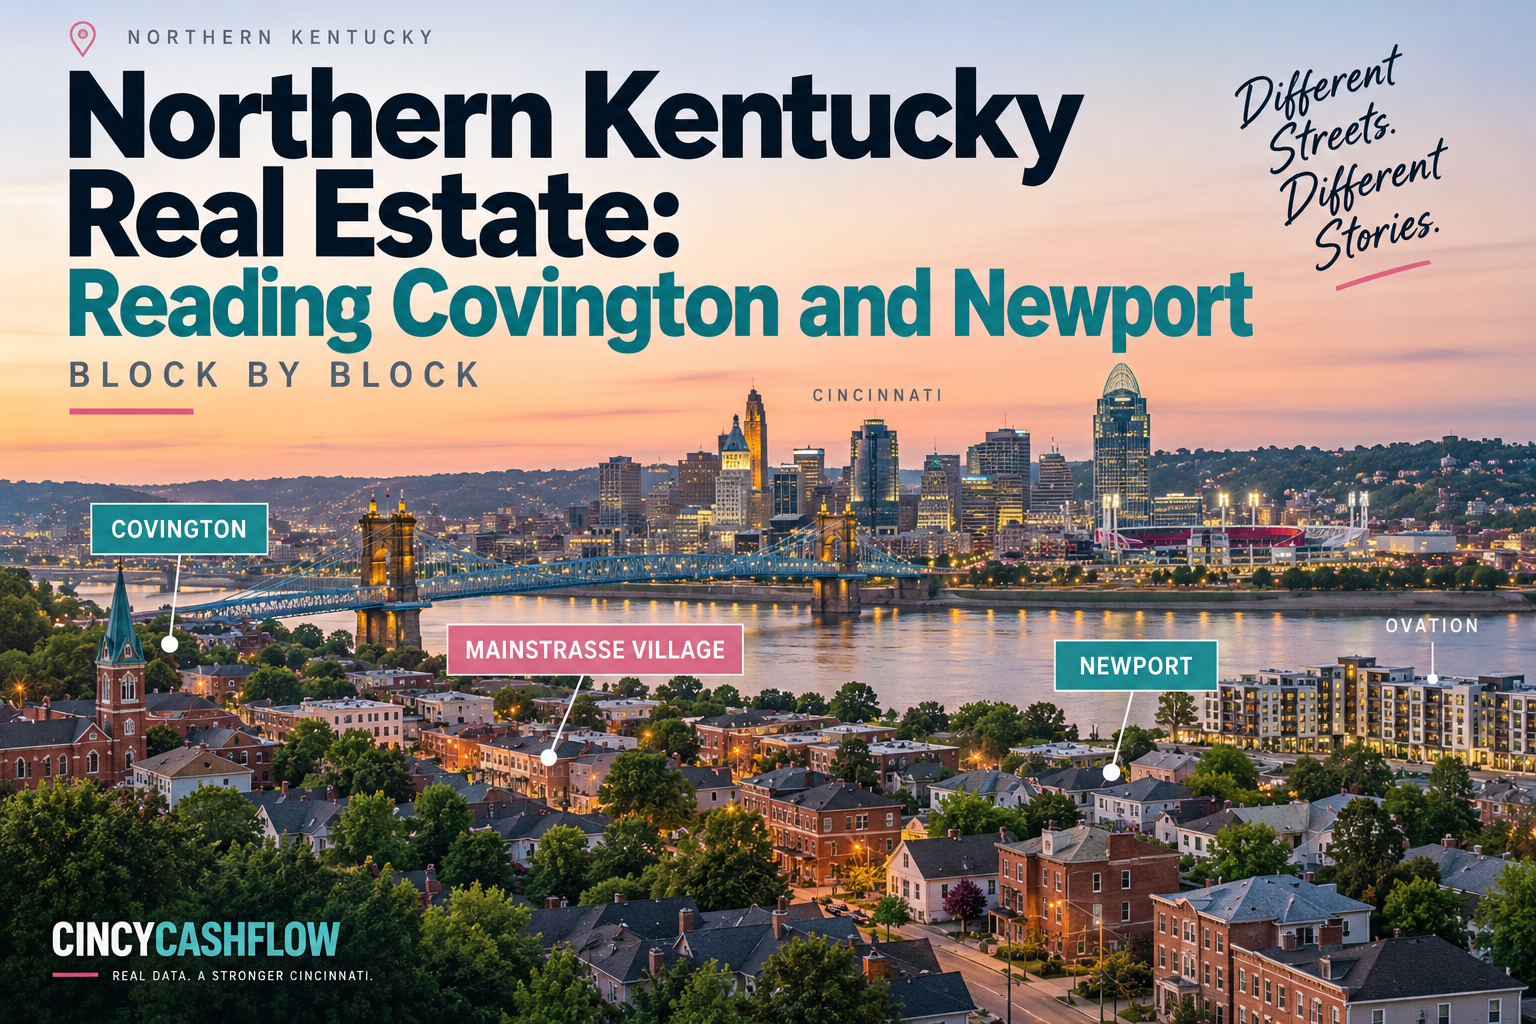
- Boone County, Northern Kentucky is the anchor of the thesis. At the time Casmon ran his research, the county had posted 30-plus consecutive years of population growth. That streak covers the dot-com boom, the 2008 recession, and everything in between, which is what made it a durable signal rather than a recent trend. Boone County sits off I-71 and I-75, just outside I-275, and holds the Cincinnati airport, which is physically in Kentucky. Amazon had announced a $1.5 billion cargo hub at that airport and had not yet broken ground when Casmon underwrote his Florence deal. Boone County is the western end of the Northern Kentucky opportunity. For the river cities east of it, Covington, Newport, Bellevue, and Dayton, see
Northern Kentucky Real Estate: Reading Covington and Newport Block by Block.
- The Montgomery Corridor, which is also Highway 22, has been circled on Casmon's buy board for seven or eight years on the recommendation of a principal at 3CRE. It runs from Evanston near Xavier University through Norwood, Pleasant Ridge, Kennedy Heights, Silverton, Deer Park, and Kenwood before reaching the suburbs, with a section in Indian Hill schools and Blue Ash in Sycamore schools. What makes it work is access. I-71 and I-75 both run north and south alongside those neighborhoods, so a renter can reach most of the metro quickly from any of them.
- Silverton, Pleasant Ridge, and Norwood are the pockets inside that corridor Casmon flags as opportunity. The pricier stretches sit further north. Casmon owns in Norwood and calls it an older neighborhood with real tradeoffs, offset by continued investment: streets being redone, new facilities, and ongoing infrastructure work. These same three neighborhoods carry a well-defined small multifamily play at the fourplex level, broken down in
Cincinnati's Fourplex Playbook.
- Butler and Warren Counties are where Casmon is bullish on the data and cautious on the math. The stock skews newer construction, which often stops penciling as deal size grows. Smaller three-unit and four-unit deals are where he sees those counties working.
- Westwood serves as his counterexample on exit liquidity. Buyers who want Westwood want it for cash flow and the money they can make, so they negotiate hard and will not pay a premium. Casmon prefers markets where a future buyer believes in the location over the long haul, which is what lets him exit a deal even when his own business plan misses.
One local boundary worth driving. Cross the railroad tracks going east out of Wyoming into Lockland and the shift is immediate and obvious in the street signs and the streetscape. Most Greater Cincinnati transitions are gradual. That one is not, and it is the kind of line that does not appear in any radius report.
Why Cincinnati Rent Growth Headlines Don't Match the Apartment Market
Two structural conditions are worth understanding before underwriting rent growth in Cincinnati real estate:
- The supply wave was a rate story, and it mostly missed the Midwest. Development penciled at 3% to 3.5% interest rates, so a large number of developers broke ground at the same time. Apartment construction runs multiple years from groundbreaking to certificate of occupancy, so those units delivered into a completely different rate environment. More new apartments were delivered than in the previous 40 years. Projected rents did not materialize because everyone competed at once. Casmon's framing on regional exposure: the Midwest produces ripples where Sun Belt markets produce waves the size of the Titanic, in both directions.
- Comps stagnate here because a large share of owners never push rent. Many Greater Cincinnati investors own free and clear, are not answering to outside capital, and have no reason to rock the boat with a paying tenant. When nobody raises rent, no comps exist to justify raising rent, and the whole submarket lags. Casmon watched a competing community near his Florence property that had never pushed rents follow him upward once he moved first. Reed described the same effect from the other direction: an owner of two four-family buildings found his management company after seeing what a renovated unit was listed for nearby.
Both conditions point the same direction for an operator. Rent growth in Greater Cincinnati apartments comes from being the one who moves first in a submarket, rather than from a rising tide the headlines promise.
What's Working in Cincinnati
Casmon's screening process is a stack, and he runs it in order. Location comes first because it is the one variable he cannot change and does not want to fight.
- Population and jobs. Where are people organically moving, and why. Casmon is explicit that he has no interest in being the person driving people into an area, because that is too much work and too much heavy lifting.
- Anchor amenities. Parks, lakes and rivers, major employers, universities, and hospitals. The question is what will still anchor that community in 10, 15, and 20 years.
- Infrastructure and physical position. Where the submarket sits, how people get in and out, and where they are going from there. Proximity to I-275 and I-75 is what makes Northern Kentucky work. Having both I-71 and I-75 alongside it is what makes the Montgomery Corridor work.
- The invisible boundaries renters actually use. Every city has a line people will not cross. In Chicago it was north and south, and which train line a neighborhood sat on. In Greater Cincinnati it is east and west, and specifically I-75 and I-71. Plenty of renters search only east of 75 and will never consider a listing west of it. That constraint does not appear in any public data set, and it defines your actual tenant pool.
Then there is the tool. Casmon uses
JusticeMap to check household income by census tract rather than by the one, three, and five-mile radius figures printed in every offering memorandum. Radius averages smooth over exactly the differences that decide a business plan. On a live pull during the episode, a tract near West Chester showed a $93,000 to $115,000 average household income sitting directly against a neighboring tract at $35,000 to $43,000. That is about as wide a gap as exists anywhere on the map, and no radius figure would surface it.
Casmon's rule on that data is measured. A tract reading low does not kill a deal. It changes the questions you ask before you move forward, and it tells you whether your business plan needs to work in a low income area. The failure mode is not knowing which one you bought.
What does not work is underwriting from broker enthusiasm. Casmon's entire podcast started because every broker he asked sold him on whichever submarket held their listing, and the answers only became useful when he started asking why.
Lessons From the Field: When a $5,000 Renovation Budget Becomes $13,000
Casmon and his partner bought the 81-unit Florence townhome community in 2021. The plan was modest: paint, carpet, roughly $5,000 a unit, and a $200 to $250 rent bump.
The comps were the first problem. There were almost no townhomes for sale in Florence to compare against, so they benchmarked against three-bedroom apartments and bungalow houses and built a deliberately conservative projection off that.
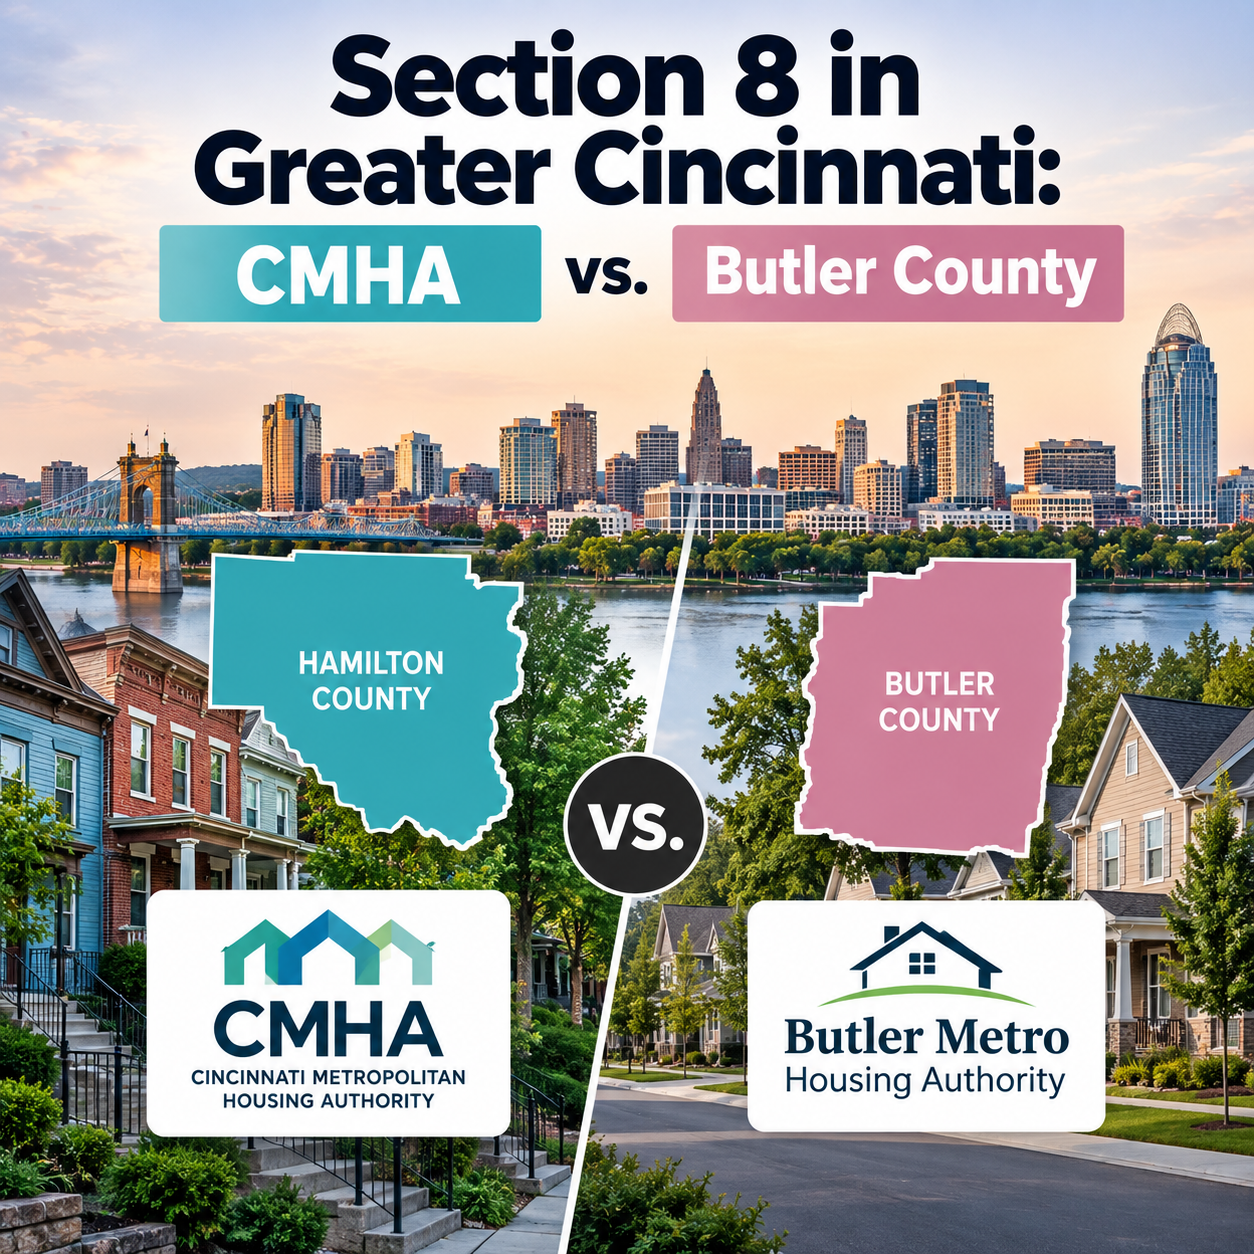
Two prior buyers had the property under contract before them, and both planned to run it as affordable housing, one specifically as a Section 8 play with discounted rents. About 25% of the property was already on Section 8 or another assisted program, and the neighboring communities included a mobile home community, so the affordable read was the obvious one. Casmon underwrote it as a B to B+ market rate community instead.
Then the turn schedule broke. Working with a third-party manager, the property sat with seven vacant units. They would turn three and three more would move out, putting them right back at seven. That pattern held for roughly a year and a half. The fix was to stop pacing it: throw as many crews at it as they could get, turn all seven at once, and absorb the cost. Casmon's framing is that maintaining occupancy is far easier than making up occupancy.
The deal sold at the end of 2025 and returned solid numbers to investors.
5 things this deal makes clear for Greater Cincinnati operators:
- A conservative rent projection built on the wrong comps is still the wrong projection. Casmon benchmarked townhomes against three-bedroom apartments and bungalows because nothing better existed, and the market told him he was low by roughly $500 a unit. When the comp set does not match the product, the number is a placeholder, not an underwrite.
- Spend per unit and rent per unit are not a fixed ratio. The renovation ran 2.5x the plan and produced roughly 3x the rent bump. Deciding to spend more only works if you are reading real leasing feedback, which is information you do not have on day one.
- Occupancy compounds in both directions. Seven vacant units that never fully turn is not a vacancy problem, it is a throughput problem, and it stays a problem until you overwhelm it. Catching up costs far more than never falling behind.
- Know the mechanics of your rate cap before you need them. Paying the elevated rate and then applying for reimbursement is a cash flow event, and the counterparty behind the cap is a real risk that most sponsors never price.
- The prior buyer's business plan is information, not instruction. Two groups underwrote this property as affordable housing. The 25% assisted tenancy and the neighboring mobile home community made that read defensible. Casmon reached a different conclusion from the same facts, and the difference was roughly $500 a unit in monthly rent.