Skyline vs. Gold Star: The 16% Income Gap Cincinnati Investors Miss
Skyline vs. Gold Star: What Cincinnati’s Chili Map Says About Rent Growth
Households closer to a Skyline earn 16% more — almost $1,000 a month. The gap is real, it’s a bad way to pick a deal, and the method behind it is the part worth keeping.
Households living closer to a Skyline than a Gold Star earn a median of $85,473 a year. Households closer to a Gold Star earn $73,498. That is a gap of more than 16%, almost $1,000 a month, across 87 Skylines, 45 Gold Stars, and about 2.25 million people in Greater Cincinnati. The analysis comes from two Cincinnati operators who manage rentals across the metro and track every for-rent primary residence listing on the Ohio side of the river.
About This Post
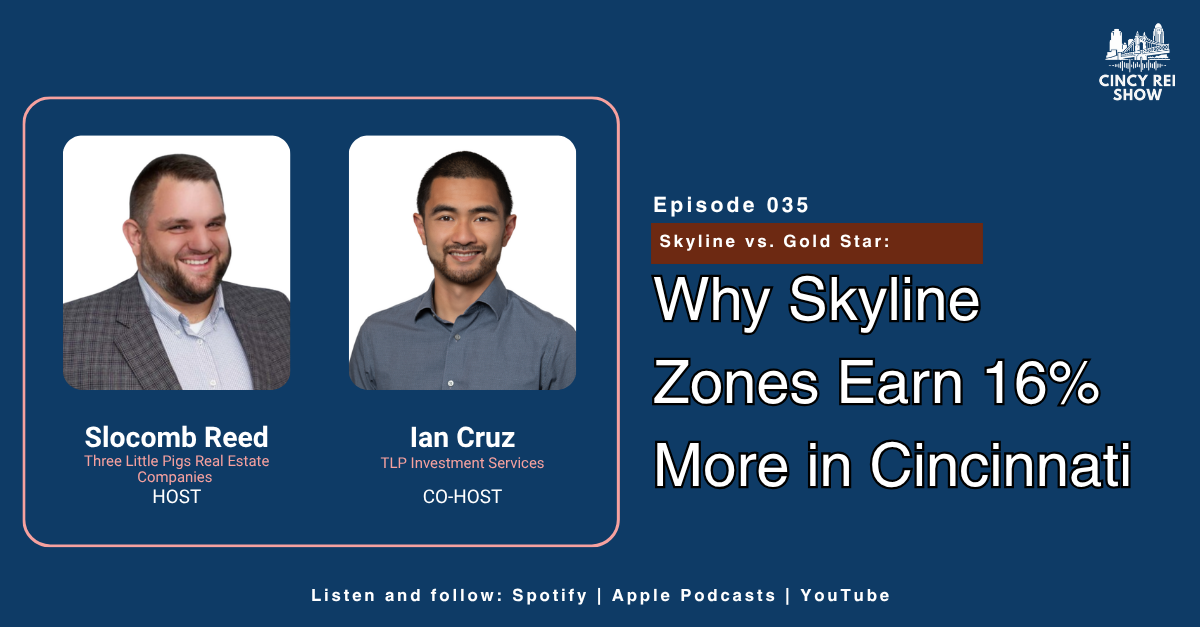
This analysis draws from a conversation between Slocomb Reed and Ian Cruz, co-founders of TLP Investment Services. Their proprietary data set tracks every primary residence rental listing across Hamilton, Clermont, Warren, and Butler Counties.
Listen to the full conversation on Spotify, Apple Podcasts, and YouTube. The episode includes the catchment maps and chili trivia.
The Cincy REI Show publishes every Monday.
The body content of your post goes here. To edit this text, click on it and delete this default text and start typing your own or paste your own from a different source.
Where Rents Have Room to Grow in Greater Cincinnati
The test is simple. Compare a zip code's median household income to its median rent. If the median household can't afford the median rent, the rent has a ceiling. If income far outpaces rent, the rent has room to move and stay affordable.
Using 2026 year-to-date median rents for 3-bed single-family houses, these zip codes have the most room:
- Blue Ash (45242), which includes Montgomery, has a median 3-bed rent of $2,150 against a median household income above $120,000.
- Mason and West Chester follow the same pattern. Incomes are high, and rents have not caught up.
- Springboro ranks near the top, though it functions more as a Dayton-area market.
- Trenton, Middletown, and Sharonville make up the next tier.
These areas carry the highest ratios, with median 3-bed rent above 40% of median household income:
- Walnut Hills, Roselawn, Evanston, East Price Hill, and Northside.
- Clifton (45219) tops the list at about $36,000 median income against $2,100 rent. It is a student market, and parents' income carries most of those leases.
Northside and Oakley show why the ratio matters more than either number alone. Northside's median income is just under $47,000 against $1,700 rent. Oakley's is just under $88,000 against $2,800. Their ratios land close together.
For 2-bed apartments, the West End (45214), Sedamsville, Riverside, Avondale, and Clifton carry the highest ratios. Hyde Park (45208), Oakley (45209), Deer Park, Silverton, and Kenwood (45236), Mason, West Chester, Mount Carmel, Middletown, and Lebanon all have median incomes about five times median 2-bed rent.
Why Income Data Belongs in Cincinnati Real Estate Underwriting
County-level income spreads wide across the seven core counties:
- Warren County, OH: almost $108,000.
- Boone County, KY: almost $95,000.
- Clermont County, OH: about $83,000.
- Butler County, OH: about $81,000.
- Kenton County, KY: about $79,000.
- Campbell County, KY: about $77,000.
- Hamilton County, OH: just under $71,000.
Warren runs more than 50% above Hamilton. County data is still too broad for acquisitions. Nobody buys a county.
Zip-level ratios break the usual perception of Cincinnati neighborhoods. The City of Hamilton, Lebanon, Hyde Park, Colerain, Mount Healthy, Monroe, and Mount Washington all sit at a 27% to 28% rent-to-income ratio for 3-bed houses. Middletown and Franklin sit at 29%. Median incomes in that group range from $66,000 to $133,000.
Home values follow the same lines as income. The median home near only a Skyline is $270,000. Near both chains it is $240,000. Near only a Gold Star it is $219,000, and near neither it is $211,000. Five-year appreciation was nearly identical: 25% in Skyline zip codes, 26% in Gold Star zip codes.
What's Working in Cincinnati
For buy-and-hold investors, the strategy rests on three inputs:
- Median household income sets the ceiling on how far rents can rise.
- Median rent relative to income shows how close a zip code is to that ceiling.
- Property value decides whether the deal cash flows today.
The target is a property that cash flows now in a zip code positioned for rent growth, with income, population, and demand all moving up. Cash flow is thin in Mason, West Chester, and Hyde Park. Where the rent-to-price ratio works there, the income data supports long-term rent growth.
New commercial construction offers a second signal. Skyline has opened nine stores since June 2023, and its three newest sites sit in growth corridors:
- Liberty Township gets a new prototype store near Lakota East High School on Route 129. The site is in an upper-income tract above $100,000, and the existing Liberty Township store's zone sits at $125,000.
- Batavia gets a 3,832-square-foot, $1 million store opening in early 2027. It follows new single-family subdivisions and sits near UC Clermont.
- Norwood gets a larger store on a 2.9-acre parcel bought from Paycor for $1 million, north of the Norwood Lateral. It replaces demand already served by a small strip-center Skyline near Factory 52.
The same lens works for selling. Zip codes where incomes cap rent growth are candidates for moving equity into areas with stronger appreciation and rent growth.
Lessons From the Field: Testing a Market Signal Before You Trust It
The question started as a joke: Skyline or Gold Star, which one is better for investors?
The data produced a real answer. Skyline zones carry more than 16% higher median household income. In suburban Butler, Warren, and Clermont Counties, the gap widens to 31.5%, with Skyline zones just under $105,000 and Gold Star zones just under $80,000.
The detail underneath complicated the story. Gold Star holds the two highest-income locations in the metro. The top one is on Wards Corner Road in Loveland, at about $150,000. In Hamilton County, the nearest Skyline to any Gold Star is 1.07 miles away.
Then came the control test. The same catchment model ran on Graeter's vs. UDF. Income and property values came out the same across the board.
The conclusion: the chili gap is real, and it is a poor acquisition screen. The method behind it is the useful part.
- Run a control before trusting a pattern. If a second pair of chains shows no gap, the first gap describes where stores happen to sit.
- Weight by population. Store-level medians mislead without household counts behind them.
- Watch new construction over legacy footprints. A store opened in 1949 reflects 1949. A store opening in 2027 reflects current research.
- Go below the county. Hamilton County shows the smallest chili gap and the widest zip-level spread in rent-to-income ratios.
- Pair income with rent. Income alone ranks wealth. Income against rent shows where rents can still move.